
Market Insight | Falmouth Real Estate

Falmouth Home Prices 2026

What September Sales Tell Us About the Market

Fewer homes sold in September, but the median price rose above $1 million. Here’s what the latest CCIMLS data means for Falmouth buyers and sellers.
What do September 2026 home sales tell us about the Falmouth real estate market?

Falmouth recorded 37 residential sales in September 2026, while the median sale price reached $1,035,000. Sales volume was lower than a year earlier, but the median price was higher—another example of why buyers and sellers need to look beyond a single statistic when evaluating the local market.

The year-to-date data tells an even more useful story: through September, Falmouth recorded 303 sales, a $900,000 median sale price, and a 15-day median time on market.

Falmouth September 2026 Market Snapshot

September 2026 (CCIMLS)
🏠
37
Sales
▼ 21.3% YoY
🏷️
$1,035,000
Median Sale Price
▲ 6.2% YoY
📐
$563
Price per Sq. Ft.
▲ 0.6% YoY
📅
23
Median Days on Market
Unchanged YoY
%
3.4%
Below Asking
Over/under ask

According to the Cape Cod & Islands Multiple Listing Service September 2026 Market Overview, these figures point to a market where fewer properties changed hands, but the homes that did sell included enough higher-priced transactions to keep the monthly median above $1 million.

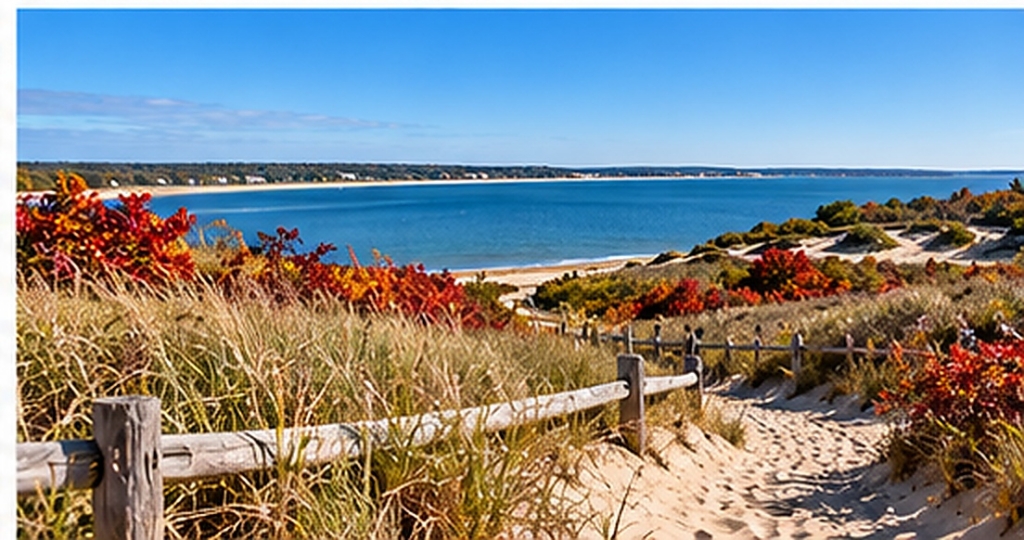
Cape Cod beach path through dunes with fall color in October

Why Did Falmouth Have Fewer Sales?

The 37 September sales represented a 21.3% decline from the same month in 2025.

A lower sales count does not automatically mean buyer demand disappeared or that values were falling. Closed-sales volume can be influenced by several factors, including how many properties were available, which price ranges were represented, seasonal timing, and how many transactions reached closing during that particular month.

For buyers and sellers, the most useful takeaway is that transaction volume and price movement should be evaluated separately. September had fewer sales, but Falmouth’s median price still increased.

What Was the Median Falmouth Home Price in September 2026?

The September median sale price was $1,035,000, up 6.2% compared with September 2025.

That does not mean every Falmouth property appreciated by 6.2%. The median simply identifies the midpoint of the properties that closed during the month. If September included a greater proportion of higher-priced homes, the median could rise even if individual properties in other segments behaved differently.

That distinction is especially important in Falmouth, where housing can range from smaller inland properties and condominiums to higher-priced coastal and waterfront homes.

Why Is the Year-to-Date Median Lower Than September?

Through September 2026, Falmouth’s year-to-date median sale price was $900,000, compared with the September-only median of $1,035,000.

That difference illustrates why one month should not be treated as the entire market. A single month reflects only the properties that happened to close during that period. Year-to-date data includes hundreds of transactions across multiple seasons and price points, making it less sensitive to an unusual mix of sales in one month.

The year-to-date median was still 2.9% higher than the comparable 2025 period, suggesting a more modest upward movement than September alone might imply.

What Does the Full 2026 Picture Look Like So Far?

Year-to-Date (Jan–Sept 2026)
🏠
303
Sales
▼ 4.4% YoY
🏷️
$900,000
Median Sale Price
▲ 2.9% YoY
📐
$533
Price per Sq. Ft.
▼ 1.8% YoY
📅
15
Median Days on Market
10 days faster
%
1.8%
Below Asking
Over/under ask

Through September, Falmouth recorded 303 residential sales, down 4.4% year over year. The same period showed:

  • $900,000 median sale price – up 2.9%
  • $533 per square foot – down 1.8%
  • 15 median days on market – 10 days faster than the prior-year period
  • Approximately 1.8% below asking price

Taken together, those numbers suggest that 2026 has not simply been a story of rising or falling prices. Sales volume was somewhat lower, the median price was higher, price per square foot was slightly lower, and homes that sold moved more quickly year to date.

That is a mixed market—and mixed markets require property-specific analysis.

How Quickly Are Falmouth Homes Selling?

Homes that closed in September had a median of 23 days on market, unchanged from the comparable period a year earlier.

Year to date, however, the median was just 15 days, which was 10 days shorter than the previous year’s comparable period.

For buyers, it means desirable and properly positioned properties may not remain available for long. For sellers, it reinforces that buyers are still making decisions quickly when a home’s price, condition, and location make sense.

Are Falmouth Homes Selling Below Asking Price?

September sales closed about 3.4% below asking price, based on the report’s over/under-asking figure. Year to date, the difference was smaller at approximately 1.8% below asking.

That does not mean every buyer should automatically offer below list price. The final sale-to-list relationship can depend on how accurately a home was priced, how long it has been available, whether the price changed during the listing period, condition, competition, and how many buyers are interested in that specific property.

The September figure does, however, show that sellers should not assume that a strong headline median price guarantees a full-price offer.

What Does Price Per Square Foot Tell Us?

Falmouth’s September price per square foot was $563, up only 0.6% year over year. Year to date, the figure was $533 per square foot, down 1.8%.

That is a good example of why median sale price and price per square foot can tell different stories. A higher median sale price can be influenced by the mix of homes being sold, while price per square foot provides another way to compare transactions.

Even then, price per square foot should not be treated as a stand-alone valuation tool. Waterfront access, condition, renovations, lot characteristics, views, location, property type, and other features can create substantial differences between homes with similar square footage.

How Does Falmouth Compare?

Falmouth

$1,035,000
Sept median
37 sales
23 median days

Upper Cape

$850,000
Sept median
110 sales
21 median days

All Cape Cod

$850,000
Sept median
339 sales
Median ▲ 15.6% YoY

Compared with Cape Cod overall: Across Cape Cod, September 2026 recorded 339 residential sales with an $850,000 median sale price. The Cape-wide median was up 15.6% year over year. Falmouth’s September median of $1,035,000 was therefore above the Cape-wide median. The same pattern appears when looking at year-to-date data: Cape Cod’s year-to-date median was $735,000, while Falmouth’s was $900,000.

This does not mean every Falmouth home costs more than every property elsewhere on Cape Cod. It simply shows that the transactions completed in Falmouth during these periods had higher median prices.

Compared with the Upper Cape: Falmouth is generally considered part of the Upper Cape region (the report’s region table does not list which towns each region includes). In September, the Upper Cape recorded 110 sales with an $850,000 median sale price, $541 per square foot, and 21 median days on market. Falmouth’s September median of $1,035,000 was therefore higher than the broader Upper Cape median. Its 23-day median market time was also close to the Upper Cape’s 21 days.

That comparison helps show why buyers and sellers benefit from drilling down beyond regional numbers. Falmouth can behave differently from the Upper Cape as a whole.

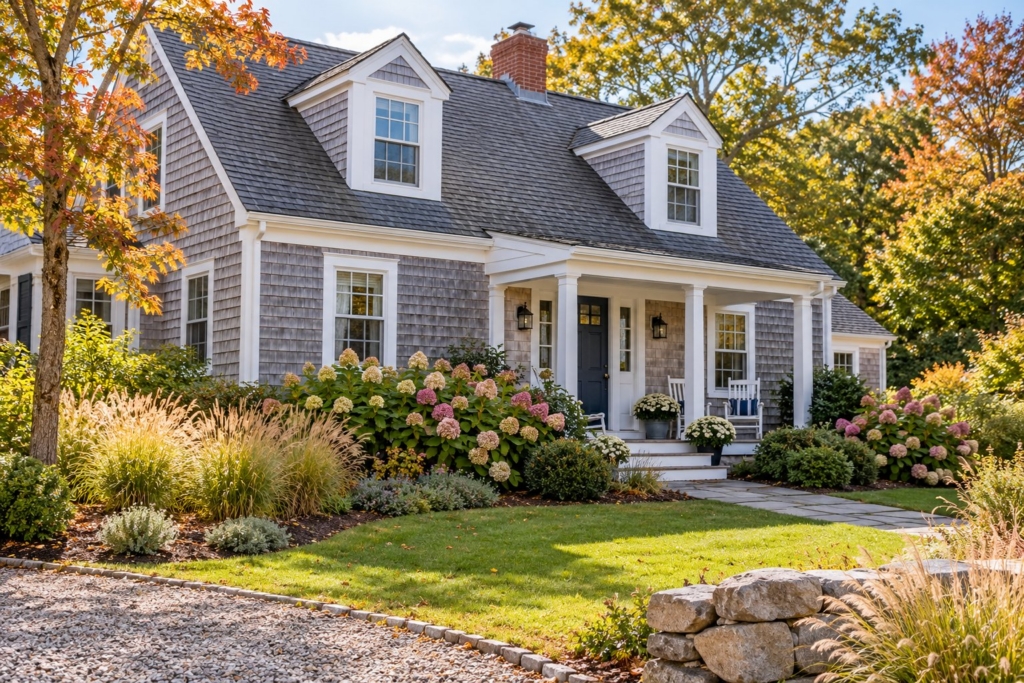
Gray-shingled Cape Cod–style home with a covered front porch and hydrangeas

What Does This Mean for Falmouth Buyers?

For buyers, the current data suggests that good preparation still matters. Falmouth homes that sold in 2026 have generally not spent long on the market. At the same time, September transactions closed about 3.4% below asking price.

Those two facts can coexist. A buyer may have room to negotiate on one property while facing stronger competition on another. Before deciding how aggressively to approach an offer, look at:

  • Recent comparable sales
  • Days on market and price history
  • Condition and recent improvements
  • Current competing listings
  • The specific Falmouth location or village
  • Property-specific considerations such as septic, flood-zone information, condominium documents, or waterfront-related factors when applicable

The town-wide market provides context. The individual property determines the strategy.

What Does This Mean for Falmouth Sellers?

For sellers, the September median above $1 million is encouraging, but it should not become the basis for pricing every Falmouth home.

The year-to-date median of $900,000 provides broader context, and the market still shows negotiation between asking and sale prices. A realistic list price should be based primarily on recent comparable properties with similar location, size, style, condition, features, and market position.

Homes that are priced and presented well can attract attention quickly. Homes that begin significantly above comparable market value may require more time or later adjustments.

Should Sellers Price Based on September’s $1.035 Million Median?

Not by itself. The median is useful for understanding the market broadly, but it is not a property valuation.

A home in East Falmouth, North Falmouth, Woods Hole, Falmouth Village, or another part of town may compete with a very different group of properties. Even within the same area, waterfront access, lot size, renovations, age, condition, and property type can substantially affect value.

The most useful pricing analysis is based on the specific home and the most relevant recent comparable sales.

Is Fall Still an Active Time for Falmouth Real Estate?

September’s 37 completed sales and 23-day median market time show that transactions were still occurring as the market moved out of peak summer.

However, buyers and sellers should avoid assuming that fall behaves exactly like spring or summer. Inventory, buyer activity, property mix, and seller motivation can change as the year progresses.

For someone considering a move, the more important question is whether the current market conditions work for their individual timeline and goals.

Shingled Cape Cod homes with stone walls overlooking a calm bay in early fall

Common Questions About the Falmouth Market

The median sale price was $1,035,000, up 6.2% from September 2025.

There were 37 residential sales, down 21.3% year over year.

The September median was 23 days on market. Year to date, the median was 15 days.

The September median was 6.2% higher year over year, while the year-to-date median was 2.9% higher. Those figures describe the properties sold during those periods; they do not mean every individual Falmouth home increased in value by those percentages.

September sales closed approximately 3.4% below asking price, while the year-to-date figure was about 1.8% below asking. Individual properties can perform very differently.

Not necessarily. It is the midpoint of the properties that closed during September. A property’s actual market value depends on its own characteristics and relevant comparable sales.

Final Takeaway

September 2026 delivered a mixed but informative set of signals for Falmouth real estate. Fewer properties sold than a year earlier, yet the monthly median rose above $1 million. Homes took a median of 23 days to sell, while transactions closed about 3.4% below asking price.

Looking at the year-to-date numbers adds important context: sales were only modestly lower, the median price was up 2.9%, and homes that sold moved faster than during the comparable 2025 period.

For buyers and sellers, the message is not simply that the Falmouth market is “up” or “down.” The better approach is to understand which part of the Falmouth market your specific property or search belongs to.

Nancy Cassano, real estate agent serving Greater Boston and Cape Cod

Thinking About Buying or Selling in Falmouth?

If you are considering a move in Falmouth or elsewhere on Cape Cod, Nancy can help you understand how the latest market data relates to the specific property, neighborhood, and price range you are evaluating.

Nancy Cassano | Realtor | Serving Greater Boston & Cape Cod
Phone: 508.954.3420
Email: nancyc@todayrealestate.com

Market Data Source

Market statistics in this article are based on the Cape Cod & Islands Multiple Listing Service (CCIMLS), Cape Cod Market Overview — September 2026, updated October 5, 2026. More Cape Cod market reports: CCIAOR Research & Market Data. Falmouth figures are reported in the town-level section of the report. The September Falmouth row reports 37 sales, a $1,035,000 median sale price, $563 per square foot, 23 median days on market, and an over/under-ask figure of −3.4%. The year-to-date row reports 303 sales, a $900,000 median sale price, $533 per square foot, 15 median days on market, and an over/under-ask figure of −1.8%.

Accuracy note: Monthly and year-to-date statistics describe the mix of properties that sold during those periods. They should not be interpreted as an appraisal or as proof that every Falmouth property changed in value by the same percentage.

Compare listings

Compare